Approx 2 minute read

Like our content? Join our ecosystem to receive fresh news and updates in real-time.
How do students approach learning when they’re granted a high degree of agency over when and how they progress through a course? What do they do when they have the freedom to complete as few or as many activities as they need – and spend as much or as little time as they need – to master the course’s learning objectives?
Watch and see for yourself.
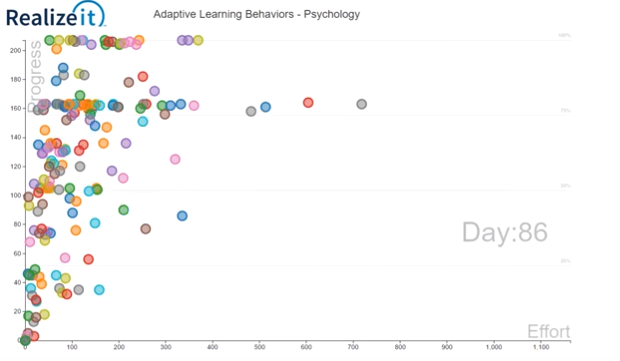
The animation below tracks the progress and behavior of 173 students through a 15-week psychology course at the University of Central Florida (UCF). The analysis is part of Realizeit Principal Researcher Colm Howlin’s ongoing research with partners such as UCF and Colorado Technical University.
Their goal is to better understand how to best help students use Realizeit as effectively as possibly, and to be able to show faculty the best ways to guide them to successful outcomes. This process starts with first understanding exactly how students work and progress through these courses, which Howlin details in the video below:
To further explore the students’ behavior, Howlin’s team created four archetypes describing the distinct patterns that emerged: the tortoise, the frog, the hare and the kangaroo. Watch to see the approaches each of these types of students takes to the course:
Interested in learning more about this research? Read the in-depth article in Educause Review published in partnership with academic leaders at UCF and CTU: